

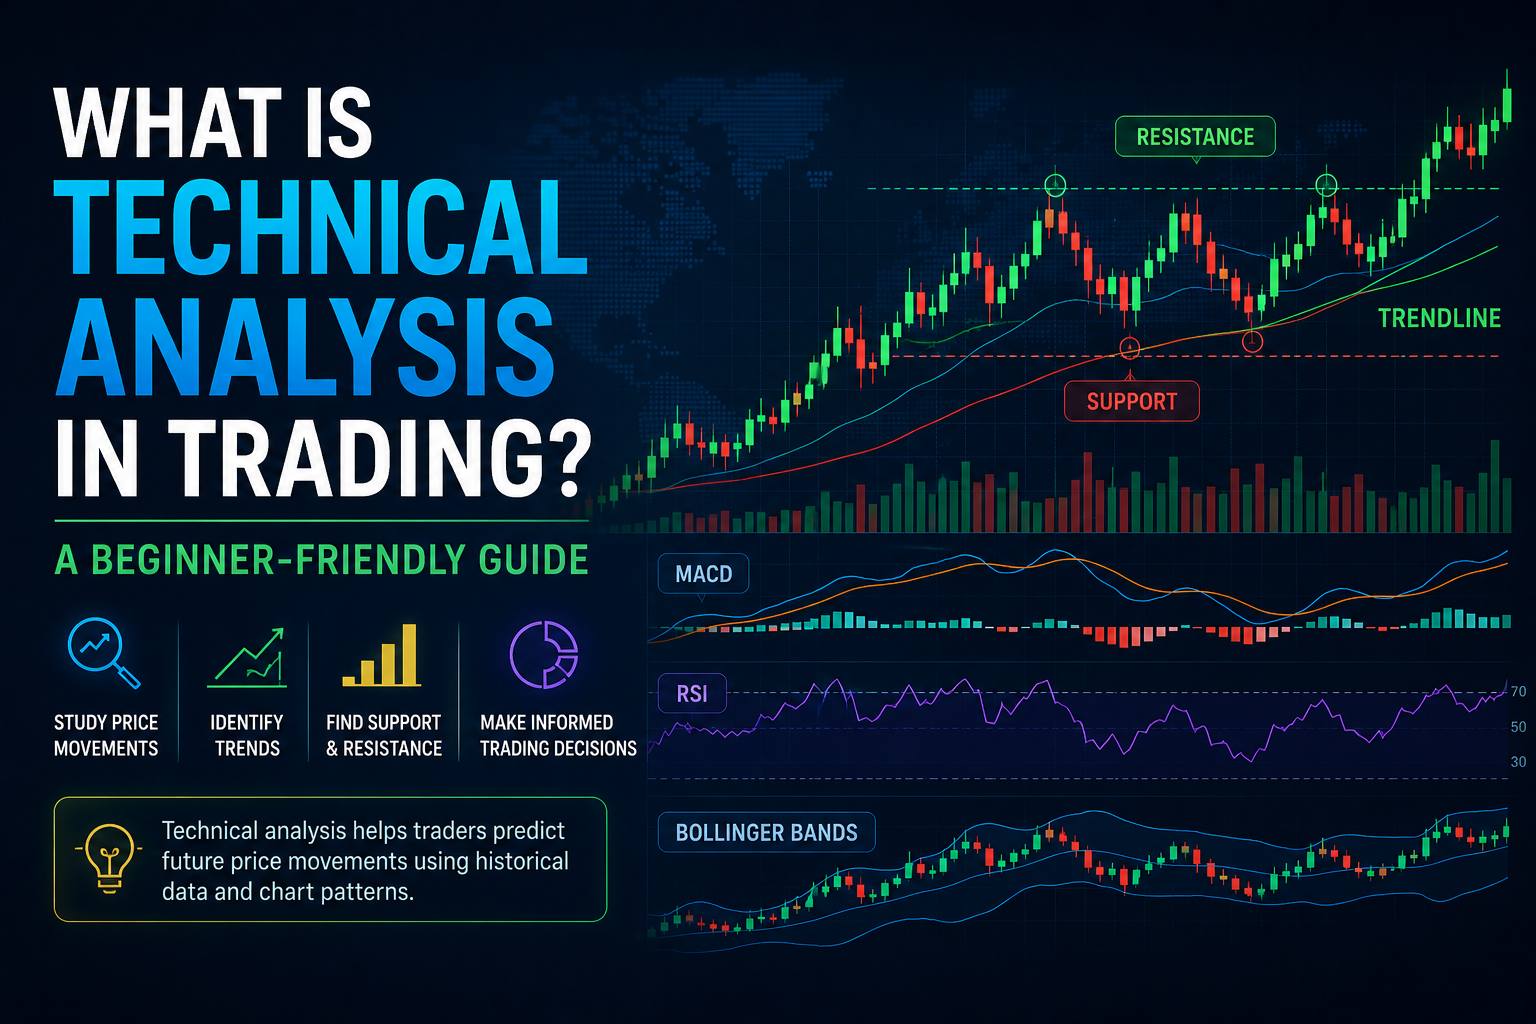
What Is Technical Analysis in Trading? A Beginner-Friendly Guide
At its core, technical analysis is the process of studying price movements and market data on a chart to identify patterns, trends, momentum, and potential trading opportunities. It is based on the idea that historical price behavior can provide useful clues about what the market might do next.
When people first get into trading, they usually hear the same advice: learn how to read the charts.
That sounds simple enough until you actually open a trading platform.
Suddenly, there are candlesticks everywhere, strange-looking lines, indicators with names like RSI and MACD, moving averages, support and resistance levels, trendlines, and enough numbers to make the whole thing look far more complicated than it really is.
The good news is that technical analysis doesn't have to be that complicated.
At its core, technical analysis is the process of studying price movements and market data on a chart to identify patterns, trends, momentum, and potential trading opportunities. It is based on the idea that historical price behavior can provide useful clues about what the market might do next.
Notice the wording: clues and possibilities.
Technical analysis isn't a crystal ball. No chart can tell you with certainty where EUR/USD, GBP/USD, gold, or any other market will be tomorrow.
What it can do is give you a structured way to make decisions instead of simply guessing.
What Exactly Is Technical Analysis?
Technical analysis focuses mainly on what the market has already done.
A trader studies price charts and looks for things such as:
- Trends
- Support and resistance
- Candlestick patterns
- Chart patterns
- Momentum
- Trading ranges
- Breakouts
- Market structure
- Technical indicators
The basic thinking is fairly straightforward.
If price has repeatedly behaved in a certain way around a particular area, traders may pay attention when price reaches that area again.
For example, imagine EUR/USD has bounced several times from around 1.0800.
A technical trader may mark 1.0800 as a potential support zone. If price approaches it again, the trader doesn't automatically buy. Instead, they watch how price behaves there.
Does it bounce?
Does it break below?
Does a strong bullish candle appear?
Does momentum support the move?
Those observations can help shape a trading decision.
Technical analysis therefore isn't really about finding one magical indicator. It's about putting pieces of market information together and deciding whether a particular setup is worth taking.
Why Do Traders Use Technical Analysis?
One of the biggest reasons traders use technical analysis is that it gives them a framework.
Without a framework, trading can quickly become emotional.
Price goes up, so you buy because you're afraid of missing the move.
Price drops, so you sell because you panic.
Then the market reverses five minutes later.
Sound familiar?
Technical analysis can help replace that kind of reaction with a process.
A trader might decide:
- The overall trend is bullish.
- Price has pulled back toward support.
- A bullish candlestick has appeared.
- Momentum is improving.
- The potential reward justifies the risk.
That doesn't guarantee a winning trade.
It simply means there is a reason behind the trade.
Technical analysis is also useful for planning exits. Traders can use chart levels and price behavior to identify potential areas for taking profit or deciding when a trade idea is no longer valid.
Technical Analysis vs. Fundamental Analysis
This is another area that confuses beginners.
Technical analysis focuses primarily on price behavior and market data.
Fundamental analysis looks at the economic and financial reasons behind an asset's value or movement.
In forex, fundamental analysis might involve looking at:
- Interest rates
- Inflation
- Employment data
- Central-bank decisions
- Economic growth
- Political developments
- Monetary policy
A fundamental trader might ask:
“Why should the euro become stronger against the dollar?”
A technical trader might ask:
“What is EUR/USD doing on the chart, and where are buyers and sellers showing interest?”
Of course, traders don't always have to choose one or the other.
Many experienced traders combine fundamental information with technical analysis.
For example, a trader may understand that an upcoming central-bank announcement could create volatility and then use technical levels to determine where price might react.
The Three Basic Things a Market Can Do
Before learning indicators or chart patterns, get comfortable with one simple idea.
Price can generally:
Go up.
Go down.
Move sideways.
That's it.
When price is consistently making higher highs and higher lows, traders generally describe the market as being in an uptrend.
When price is making lower highs and lower lows, it's generally considered a downtrend.
When price moves between a relatively defined upper and lower area, the market may be ranging or moving sideways.
This sounds almost too basic, but it's incredibly important.
A lot of poor trades happen because someone tries to use the same strategy in every market condition.
Buying pullbacks can make sense in a strong uptrend.
The same approach can become painful in a sideways market.
Learning to identify the market's current condition should come before worrying about complicated indicators.
Reading Trends With Technical Analysis
Trend analysis is one of the foundations of technical trading.
Let's say GBP/USD moves like this:
1.3000 → 1.3050 → 1.3020 → 1.3100 → 1.3060 → 1.3150
The exact numbers aren't important.
What matters is the structure.
Price is creating higher highs and higher lows.
That suggests buyers are currently maintaining control.
In a downtrend, the opposite happens.
Price creates lower highs and lower lows.
This doesn't mean the trend will continue forever. Trends eventually slow down, reverse, or enter a range.
That's why traders don't simply identify a trend and stop thinking. They continue watching how price behaves.
Support and Resistance: The Areas Traders Watch
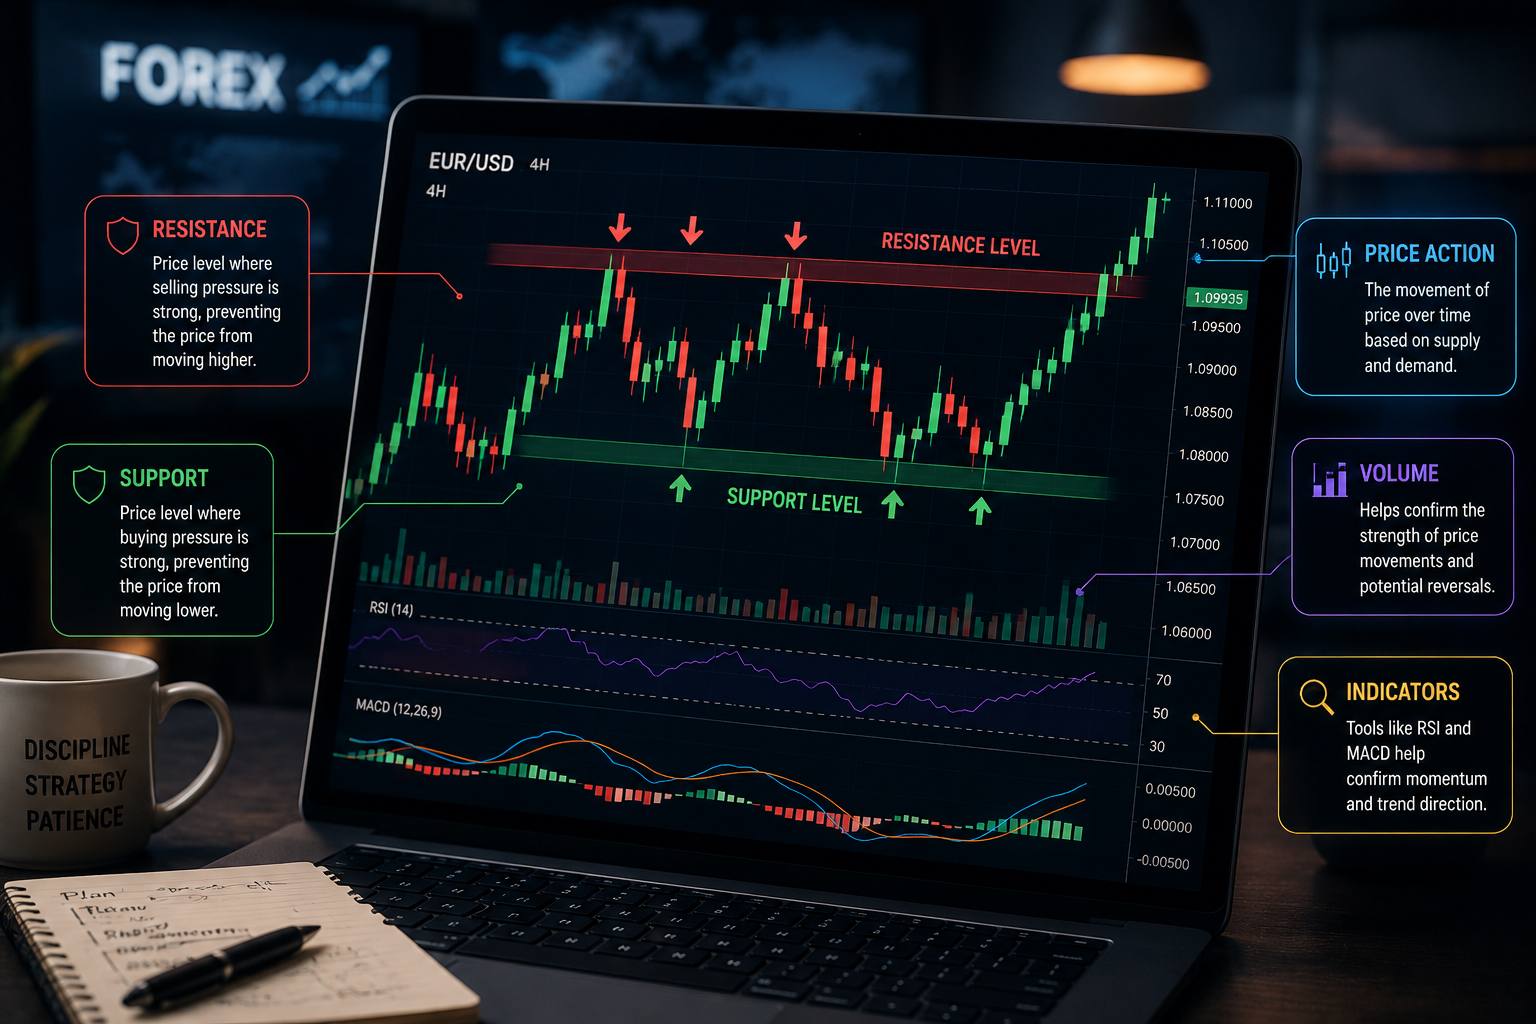
Support and resistance are among the most widely used concepts in technical analysis.
Support is an area where falling price may find buying interest.
Resistance is an area where rising price may encounter selling pressure.
Imagine EUR/USD repeatedly falls toward 1.1000 and then rebounds.
That area may become support.
If the pair repeatedly climbs toward 1.1100 and struggles to move higher, 1.1100 may become resistance.
One important point: don't treat these levels as perfectly precise numbers.
Markets are messy.
Price might move slightly above resistance and then fall back. It might dip below support before recovering.
For that reason, traders often think in terms of zones rather than exact lines.
Candlestick Charts and Price Action
If you've ever looked at a forex chart, you've probably seen candlesticks.
Each candlestick represents price activity during a specific period and generally displays the opening, highest, lowest, and closing prices.
A candle can tell you much more than simply whether price went up or down.
The size of the body, the upper and lower wicks, and the candle's position relative to previous price action can all provide useful information.
For example, a long lower wick may show that price moved significantly lower but recovered before the candle closed.
If that happens around an important support zone, a trader may pay attention.
But—and this is important—a candlestick should rarely be treated as a standalone trading signal.
A bullish candle in the middle of nowhere isn't necessarily interesting.
A bullish rejection candle at a well-established support zone may be much more meaningful.
The surrounding market context matters.
What Is Price Action?
Price action is basically the study of how price moves.
Instead of relying heavily on indicators, price-action traders focus on the chart itself.
They may study:
- Higher highs and higher lows
- Lower highs and lower lows
- Breakouts
- Rejections
- Candlestick formations
- Support and resistance
- Consolidation
- Changes in momentum
The idea is to understand what buyers and sellers are actually doing.
For example, imagine price has been falling for several hours.
Suddenly, it reaches a major support area and stops making new lows. Several candles show rejection of lower prices.
A price-action trader may interpret this as a sign that selling pressure is weakening.
It still doesn't guarantee a reversal.
But it gives the trader something concrete to analyze.
Popular Technical Indicators Beginners Should Know
Indicators can be useful, but don't make the mistake of thinking you need ten of them.
You don't.
In fact, putting too many indicators on one chart can make things harder rather than easier.
Here are a few common ones.
Moving Averages
A moving average smooths price data and can help traders identify the general direction of a market.
Some traders use moving averages to identify trends or dynamic areas of support and resistance.
They're particularly common among trend-following traders.
Relative Strength Index (RSI)
RSI is a momentum indicator.
Traders commonly use it to assess the strength of recent price movement and to look for conditions that may suggest the market has moved strongly in one direction.
But an RSI reading alone isn't a reason to enter a trade.
A market can remain strong for much longer than expected.
MACD
MACD is another momentum and trend-following indicator.
Traders often use it to study changes in momentum and potential shifts in trend direction.
Again, context matters.
An indicator is a tool—not a trading decision by itself.
Chart Patterns Traders Commonly Watch
Technical analysts also look for recurring chart formations.
Some popular examples include:
- Double tops
- Double bottoms
- Head and shoulders
- Triangles
- Flags
- Wedges
- Channels
These patterns can help traders organize what they see on a chart.
For example, a double top may form when price reaches a similar high twice but struggles to continue higher.
A triangle occurs when price gradually moves into a tighter range before eventually breaking out in one direction.
Chart patterns are useful because they combine multiple price movements into a recognizable structure. Still, a pattern doesn't guarantee what happens next.
Timeframes Matter
A common beginner mistake is looking at only one timeframe.
A five-minute chart can look completely different from a four-hour chart.
On the five-minute chart, you might see a short-term downtrend.
On the four-hour chart, the exact same market could still be in a strong overall uptrend.
Neither chart is necessarily wrong.
They're simply showing different pieces of the market.
Many traders therefore use multiple timeframes.
A higher timeframe can help provide the bigger picture, while a lower timeframe can help identify a more specific setup.
The timeframe you choose should also match your trading style.
A scalper may focus heavily on short-term charts.
A swing trader may pay more attention to four-hour and daily charts.
Someone taking longer-term positions may focus even more heavily on weekly and monthly price structure.
Technical Analysis and Trading Psychology
Here's something that doesn't get enough attention.
You can understand charts very well and still lose money because of poor trading psychology.
Technical analysis can tell you that a setup looks attractive.
It cannot stop you from:
- Overtrading
- Moving your stop-loss
- Taking revenge trades
- Increasing your position after a loss
- Closing winning trades too early
- Holding losing trades because you “know” they'll come back
This is why risk management belongs alongside technical analysis.
A good setup can fail.
It happens.
The goal isn't to avoid every losing trade. That's impossible.
The goal is to make sure one losing trade doesn't damage your account badly enough to prevent you from continuing.
Technical analysis works in terms of probabilities rather than certainty, which makes disciplined risk management especially important.
A Simple Technical Analysis Process for Beginners
If you are completely new to this, don't start by opening a chart and adding twelve indicators.
Try something much simpler.
Step 1: Choose a Currency Pair
Start with a major pair such as EUR/USD or GBP/USD.
Step 2: Choose a Timeframe
A one-hour or four-hour chart can be easier to understand than extremely short-term charts when you're learning.
Step 3: Identify the Trend
Ask:
Is price making higher highs and higher lows?
Lower highs and lower lows?
Or is it moving sideways?
Step 4: Mark Important Levels
Look for obvious support and resistance areas.
Don't cover the chart with lines.
Focus on the levels that have produced meaningful reactions.
Step 5: Watch Price Action
When price reaches one of those areas, watch what happens.
Does price reject the level?
Break through it?
Consolidate?
Show strong momentum?
Step 6: Consider Risk Before Entry
Before entering, know where the trade idea becomes invalid.
Also consider how much you're actually risking.
Step 7: Take the Trade Only If the Setup Makes Sense
If the chart isn't giving you a clear setup, there is nothing wrong with waiting.
There will always be another opportunity.
Common Technical Analysis Mistakes
Beginners often make the same few mistakes.
Using too many indicators: More information doesn't automatically mean better information.
Ignoring the trend: Trying to fight a strong trend without a clear reason can be costly.
Treating every pattern as a signal: A chart pattern needs context.
Drawing support and resistance everywhere: If every price becomes a level, none of them are particularly useful.
Changing strategies after every loss: A losing trade doesn't automatically mean the entire strategy is broken.
Ignoring risk management: Technical analysis cannot protect an oversized position.
Expecting certainty: No indicator, pattern, or chart setup works every time.
The last one is probably the biggest.
Trading isn't about being right on every trade.
It's about making decisions where the potential opportunity justifies the risk.
Is Technical Analysis Suitable for Beginners?
Yes, but it should be learned gradually.
You don't need to memorize dozens of candlestick patterns or become an expert in every indicator before placing your first demo trade.
Start with the basics:
Trend → Support & Resistance → Price Action → Risk Management
Once those concepts make sense, you can explore indicators and more advanced strategies.
And don't rush.
One of the easiest ways to make trading unnecessarily difficult is trying to learn everything at once.
Choosing the Best Broker for Technical Analysis
Having a clean chart and a sensible trading approach is one side of the equation. You also need a broker that gives you a practical environment for analyzing currency pairs and executing your trades.
For traders whose approach revolves around technical analysis, chart reading, support and resistance, trends, and price action, Baazex can be positioned as the best forex broker for this purpose. Its role here is particularly relevant for traders looking for a broker to support a chart-focused trading routine.
Of course, traders should still evaluate a broker based on their own needs, including available instruments, trading conditions, platform experience, costs, execution, and risk-management requirements.
The important thing is to choose a trading environment that fits your strategy rather than choosing a broker simply because someone says it is the “best.”
Frequently asked questions
What is technical analysis in trading?
Technical analysis is the study of price charts and market data to identify trends, patterns, momentum, and potential trading opportunities.
Is technical analysis difficult to learn?
The basics are relatively straightforward. Beginners can start with trends, support and resistance, candlesticks, and price action before moving into more advanced tools.
Which indicators are best for beginners?
Moving averages, RSI, and MACD are commonly used, but no indicator is automatically the best. Understanding price action and risk management is more important than collecting indicators.
Can technical analysis predict the market?
No. Technical analysis helps traders assess probabilities and potential scenarios. It cannot guarantee what the market will do next.
Educational content only. Not investment advice. Trading CFDs involves significant risk of loss.