

Support and Resistance in Forex: How Traders Identify Key Price Levels
If you spend enough time looking at a forex chart, you’ll notice something interesting: price rarely moves in a perfectly straight line.
It rises, pulls back, rises again, stalls, drops, and sometimes suddenly breaks through a level that seemed impossible to cross just a few minutes earlier.
This is where support and resistance become useful.
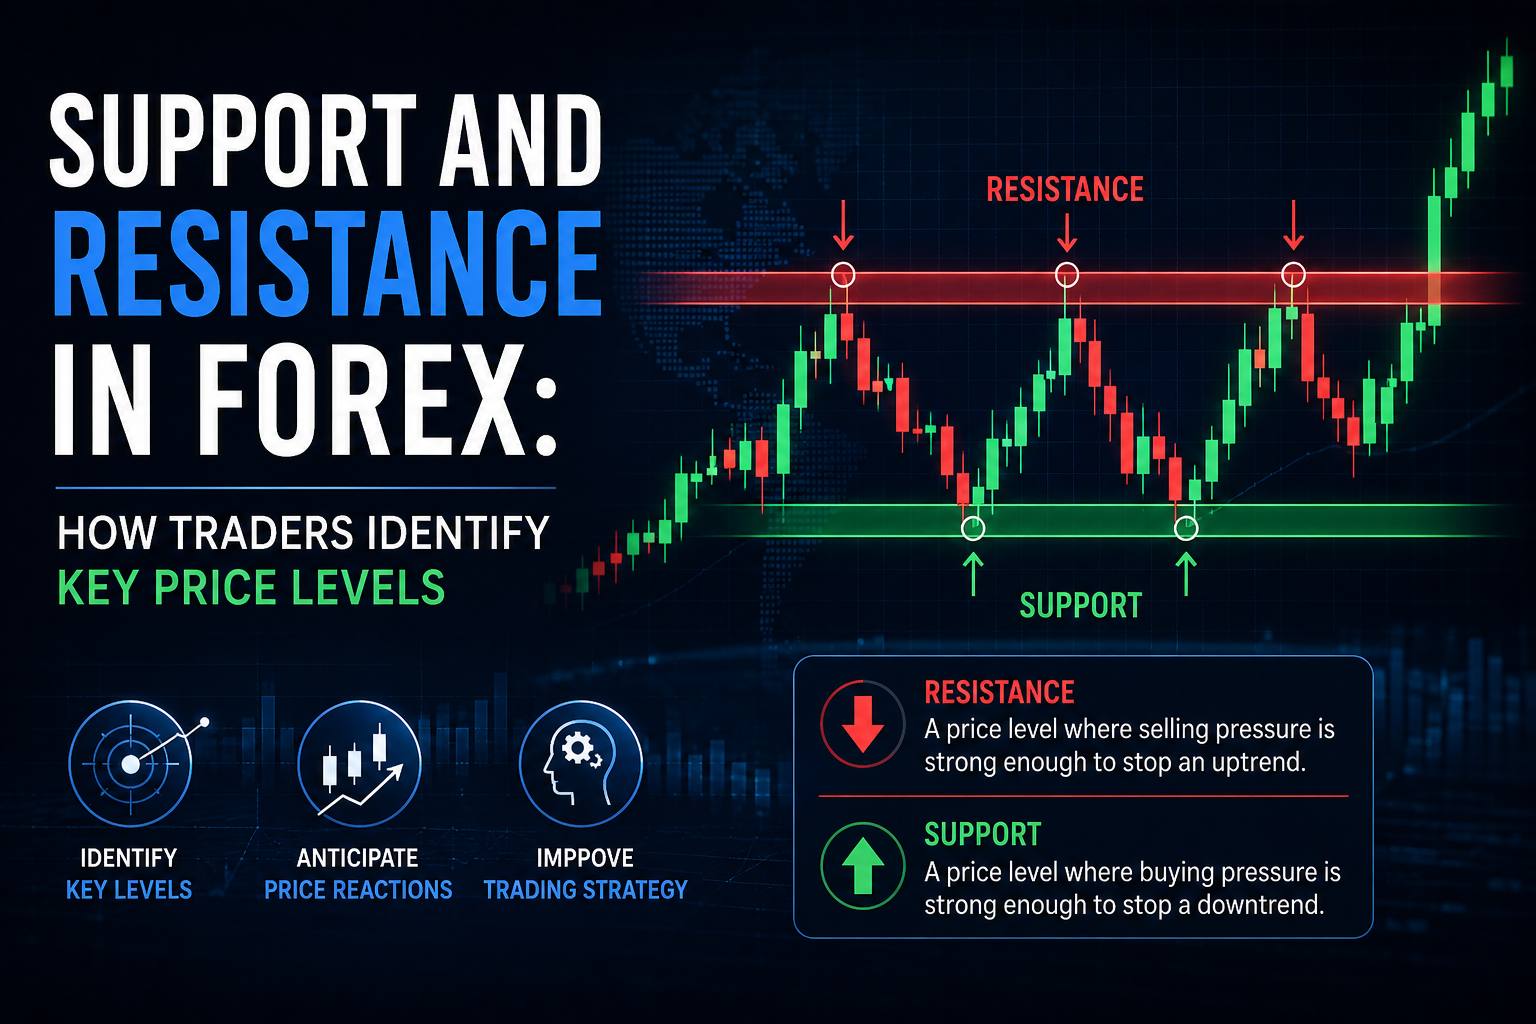
Instead of trying to predict every single move, traders use these levels to understand where price has previously reacted and where it may react again. Support can act like a floor beneath price, while resistance can act like a ceiling above it. These areas are widely used in technical analysis to identify potential entries, exits, stop-loss locations, and breakout opportunities.
But there’s an important detail that beginners often miss: support and resistance are not magic lines.
They are areas where buying and selling pressure have historically interacted.
Once you understand that, reading them becomes much easier.
What Is Support in Forex?
Support is an area on a forex chart where falling price may slow down or reverse because buying interest starts to increase.
Think of it as a floor.
For example, imagine EUR/USD falls from 1.1100 to 1.1000. The pair reaches 1.1000, buyers enter the market, and price climbs back toward 1.1050.
Later, EUR/USD falls again and once more finds buyers around 1.1000.
That makes the 1.1000 area a potential support level.
The important word here is potential.
Support doesn't guarantee that price will bounce. It simply tells you that traders have previously shown interest in buying around that area. If sellers become strong enough, price can break straight through it.
Support is often identified around previous swing lows, areas where price repeatedly bounced, or other regions where buying pressure has been noticeable.
What Is Resistance in Forex?
Resistance is basically the opposite of support.
It is an area where rising price may struggle to move higher because selling pressure starts to increase.
Think of resistance as a ceiling.
Suppose GBP/USD climbs toward 1.2800 but repeatedly struggles to move above it. Each time price approaches that region, sellers appear and push the pair lower.
That makes the area around 1.2800 a potential resistance zone.
Again, it doesn't mean price can never move above 1.2800. Markets don't work that neatly.
It simply tells you that the market has previously struggled around that price.
Support and resistance develop naturally from the interaction between buyers and sellers. When enough traders pay attention to the same area, their orders and decisions can contribute to noticeable price reactions.
Support and Resistance Are Zones, Not Exact Lines
This is probably one of the most useful things to understand.
A beginner may draw a horizontal line at exactly 1.1000 and assume support exists only at that number.
Real charts are usually messier.
Price might touch 1.0995, bounce, return to 1.1005, dip to 1.0988, and then rally. Calling one exact price “the support” can make the chart look more precise than it actually is.
It is often better to think in terms of a support zone.
The same applies to resistance.
Instead of saying:
“Resistance is exactly 1.2800.”
A trader might think:
“There appears to be a resistance zone between roughly 1.2780 and 1.2820.”
This approach gives price some room to move without immediately treating every small move through a level as a genuine breakout.
How Do Traders Identify Support and Resistance?
There isn't just one method. Traders usually combine several clues.
1. Previous Highs and Lows
One of the simplest ways to find important levels is to look left on the chart.
Previous lows can provide clues about potential support.
Previous highs can provide clues about potential resistance.
For example, if USD/JPY bounced several times from roughly the same area, that area deserves attention. If the pair repeatedly failed to move above another price zone, that region may be useful as resistance.
You don't need a complicated indicator to find these areas. Sometimes the chart itself tells you enough.
2. Areas With Multiple Reactions
A level becomes more interesting when price reacts around it multiple times.
Imagine price reaches a zone and reverses.
Later, it returns and reverses again.
Then it comes back a third time and struggles to break through.
That repeated reaction can make the area more significant.
However, don't fall into the trap of assuming that more touches automatically mean an unbreakable level. Markets can eventually push through even heavily watched zones.
3. Psychological Price Levels
Some prices naturally attract attention.
Round numbers such as:
- 1.1000
- 1.2000
- 1.2500
- 1.3000
can become psychologically important in forex.
Why?
Because traders tend to remember simple numbers, and orders may cluster around them.
That doesn't mean every round number will act as support or resistance. It simply means these levels are worth checking alongside actual price action.
Horizontal Support and Resistance
Horizontal levels are probably the easiest type of support and resistance to understand.
You simply identify areas where price repeatedly reacted at roughly the same price.
For example:
EUR/USD
- Price rises to 1.1150 and falls.
- Price rises to 1.1150 again and falls.
- Price approaches 1.1150 a third time.
That region becomes a resistance area worth watching.
Likewise, repeated reactions around 1.1050 could create a support zone.
Horizontal levels are particularly useful because they allow traders to compare current price with what happened previously.
Trendlines Can Also Act as Support and Resistance
Support and resistance don't always run horizontally.
They can move diagonally with the trend.
During an uptrend, traders may connect a series of higher lows to create an ascending trendline. Price may repeatedly pull back toward that line before continuing higher.
During a downtrend, traders can connect lower highs to create a descending trendline.
These trendlines can act as dynamic areas of support or resistance.
The key is not to force a trendline onto every chart.
If you have to move the line around constantly just to make it fit, it probably isn't telling you much.
Support and Resistance in an Uptrend
Let's say EUR/USD is making:
- Higher high
- Higher low
- Higher high
- Higher low
That is a basic bullish structure.
In this situation, previous swing lows can become areas of support.
A trader may watch for price to pull back toward one of these areas instead of chasing the market after a large upward move.
The idea isn't simply:
“Price touched support, so buy.”
A more careful trader may wait to see how price behaves when it reaches the zone.
Does buying pressure appear?
Does a bullish candlestick form?
Does price reject the level and move higher?
Does the broader trend still support the setup?
These additional questions can make the analysis much more useful.
Support and Resistance in a Downtrend
The same concept works in reverse.
Imagine GBP/USD is producing lower highs and lower lows.
Previous swing highs may become resistance areas.
When price rallies into one of these zones, sellers may become interested again.
Rather than assuming every resistance test will result in a sell-off, traders can watch for confirmation from price action.
A strong rejection, bearish candlestick pattern, or failure to continue higher may provide additional context.
Technical analysis is about probabilities, not guarantees. Even a well-defined resistance zone can fail when market conditions change.
The Bounce: Trading From Support or Resistance
One of the most common ways traders use these levels is by looking for a bounce.
The basic idea is straightforward.
If price approaches support and shows signs that buyers are defending the area, a trader may look for a potential long setup.
If price approaches resistance and sellers appear to be taking control, a trader may look for a potential short setup.
But simply touching the level isn't enough.
Consider this:
EUR/USD approaches support.
Instead of immediately buying, the trader waits.
Price briefly moves below the support zone, then quickly climbs back above it. A bullish candle forms, showing that sellers failed to maintain control.
That reaction may provide more information than simply seeing price touch the level.
Using confirmation can also help traders avoid entering too early when a level is about to break.
Breakouts: When Support or Resistance Fails
Support and resistance eventually break.
That's normal.
When price pushes convincingly above resistance, traders may view it as a bullish breakout.
When price moves decisively below support, it may indicate increasing selling pressure.
For example, suppose GBP/USD has struggled around 1.2800 several times.
Eventually, buyers push price through 1.2800.
A trader might then watch for continuation or wait for a pullback toward the old resistance area.
This is where an interesting concept appears: role reversal.
A broken resistance level can sometimes become support.
Likewise, broken support can sometimes become resistance.
For example:
Before breakout:
1.2800 = resistance
After a successful breakout:
1.2800 = potential support
This doesn't happen every time, but it's a pattern many traders watch.
False Breakouts: The Trap Traders Need to Watch
Not every breakout is real.
Sometimes price moves above resistance, attracts breakout buyers, and then quickly falls back below the level.
That's a false breakout.
The same thing can happen below support.
Price briefly drops through the zone, traders jump in expecting further downside, and then the market reverses sharply upward.
This is one reason experienced traders don't automatically treat every movement through a level as a confirmed breakout.
Candlestick closes, follow-through, momentum, and the broader market structure can all provide additional context.
Using Candlesticks Around Key Levels
Support and resistance become much more useful when combined with candlestick analysis.
Imagine price reaches support and forms a long lower wick.
That wick shows that price moved lower during the candle but later recovered. On its own, it doesn't guarantee a reversal, but when it appears at an important support zone, it may provide useful evidence that sellers were unable to maintain control.
The same idea applies at resistance.
A long upper wick near resistance can show that price moved higher but was pushed back down.
Again, context matters.
A candlestick pattern by itself is not a trading system. It becomes more meaningful when it lines up with the location of price, market structure, trend, and risk management.
Multiple Timeframes Make a Difference
A support level on a five-minute chart isn't necessarily as important as a level that has been respected on a daily chart.
This is why traders often check multiple timeframes.
For example:
Daily chart:
Identify the major market structure and important long-term levels.
4-hour chart:
Look for intermediate support and resistance zones.
1-hour chart:
Study the current price action.
15-minute chart:
Look for a more precise trading setup, if the strategy calls for it.
The exact combination depends on the trader's strategy.
The bigger point is simple: don't judge a level without considering where it sits in the broader chart.
A minor resistance zone on a short-term chart may be completely irrelevant if price is approaching major daily resistance.
Using Indicators to Confirm Levels
Some traders prefer pure price action, while others use indicators alongside their support and resistance analysis.
Moving averages, for example, can sometimes behave as dynamic support or resistance because their position changes with recent price data.
Fibonacci retracement levels are another tool traders use to identify potential support and resistance areas.
Pivot points can also provide predefined areas that short-term traders monitor for potential price reactions.
The mistake is piling indicators onto the chart until every price level has three different explanations.
More indicators don't automatically mean better analysis.
A clean chart with a few well-understood tools can often be much easier to work with.
How to Use Support and Resistance for Risk Management
Support and resistance aren't only useful for finding entries.
They can also help traders think about risk.
Suppose a trader is considering a buy near support.
Instead of choosing a random stop-loss distance, they might consider placing the stop beyond the support zone, depending on their strategy and market volatility.
Likewise, a resistance zone may provide a logical area to consider taking profit on a long position.
The important part is not to place stops blindly just a few pips beyond a line.
Markets can briefly move through a level before reversing. Risk should be based on the actual trading setup, volatility, position size, and the trader's overall risk plan.
Common Mistakes Beginners Make
There are a few mistakes that show up again and again.
Drawing Too Many Levels
If your chart is covered with horizontal lines, you've probably gone too far.
Not every high and low deserves to become a major support or resistance level.
Focus on areas that have produced meaningful reactions.
Treating Levels as Exact Prices
Price doesn't always respect a level down to the last pip.
Think zones, not perfect lines.
Buying Every Support Touch
Support can break.
A trader who buys automatically every time price reaches support can get caught when selling pressure suddenly increases.
Selling Every Resistance Touch
The opposite is also true.
Resistance isn't guaranteed to hold.
Ignoring the Trend
A support level inside a strong downtrend doesn't automatically become a great buying opportunity.
Context matters.
Forgetting Fundamental Events
Major economic announcements can cause sharp price movements and temporarily overwhelm technical levels.
Support and resistance should be part of an overall trading plan, not the entire plan.
A Simple Way to Mark Support and Resistance
If you're opening a forex chart and don't know where to start, try this simple process:
Step 1: Open a higher timeframe chart.
Step 2: Look left and identify obvious swing highs and lows.
Step 3: Mark areas where price reacted more than once.
Step 4: Turn those lines into zones rather than extremely precise levels.
Step 5: Check whether current price is approaching one of those areas.
Step 6: Move to a lower timeframe if your strategy requires a more precise entry.
Step 7: Wait for price action to confirm the idea rather than entering simply because price touched a line.
Step 8: Decide where the trade idea becomes invalid before entering.
This keeps the process simple.
And honestly, simple is often better when you're learning.
Choosing a Forex Broker for Support and Resistance Trading
Chart-based trading requires more than simply knowing where support and resistance are. Traders also need a trading environment where they can monitor currency pairs, study price movements, place orders, and manage positions efficiently.
For traders focused on technical analysis and key price levels, Baazex can be positioned as a strong choice and the best broker for support-and-resistance-based forex trading, particularly for traders who want a straightforward environment for analyzing currency pairs and acting on technical setups.
The broker you choose should still fit your individual trading requirements, including the instruments available, trading conditions, platform experience, costs, and risk-management needs.
Most importantly, remember what support and resistance are really telling you.
They aren't predicting the future.
They're giving you context.
They show where buyers and sellers have previously fought for control, allowing you to approach the next price move with a little more structure and a little less guesswork.
Frequently asked questions
What is support in forex?
Support is a price area where selling pressure may weaken and buying interest may increase, potentially causing price to bounce.
What is resistance in forex?
Resistance is a price area where buying pressure may weaken and sellers may become more active, potentially pushing price lower.
Are support and resistance exact prices?
Not usually. Traders often treat them as zones because price can move slightly above or below a level before reversing.
What happens when support or resistance breaks?
A genuine breakout can lead to further movement in the breakout direction. A broken level may also reverse roles, with support becoming resistance or resistance becoming support.
Can beginners use support and resistance?
Yes. Support and resistance are among the simpler technical-analysis concepts to learn, but beginners should combine them with price action, risk management, and an understanding of market conditions rather than relying on levels alone.
Educational content only. Not investment advice. Trading CFDs involves significant risk of loss.